



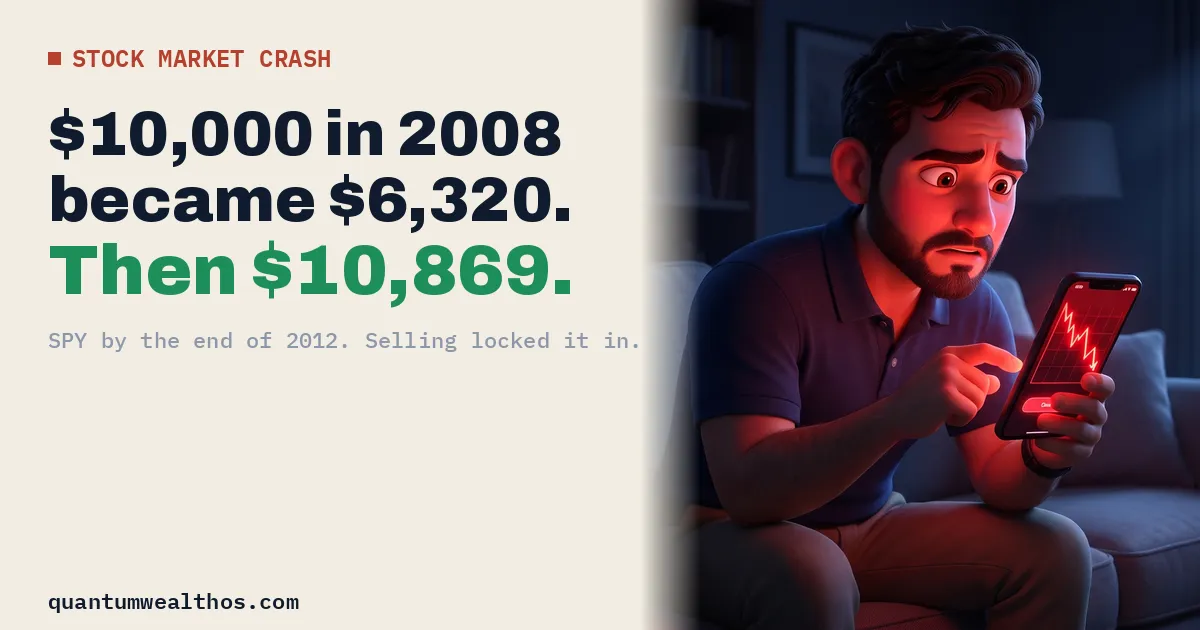
Every few years the market drops hard, and every time the headlines say it’s different. So let’s skip the headlines and run the real numbers.
2008: $10,000 in SPY
Put $10,000 into SPY (the S&P 500 fund) on the first day of 2008. By December it’s worth $6,320, down 36.8% in one year.
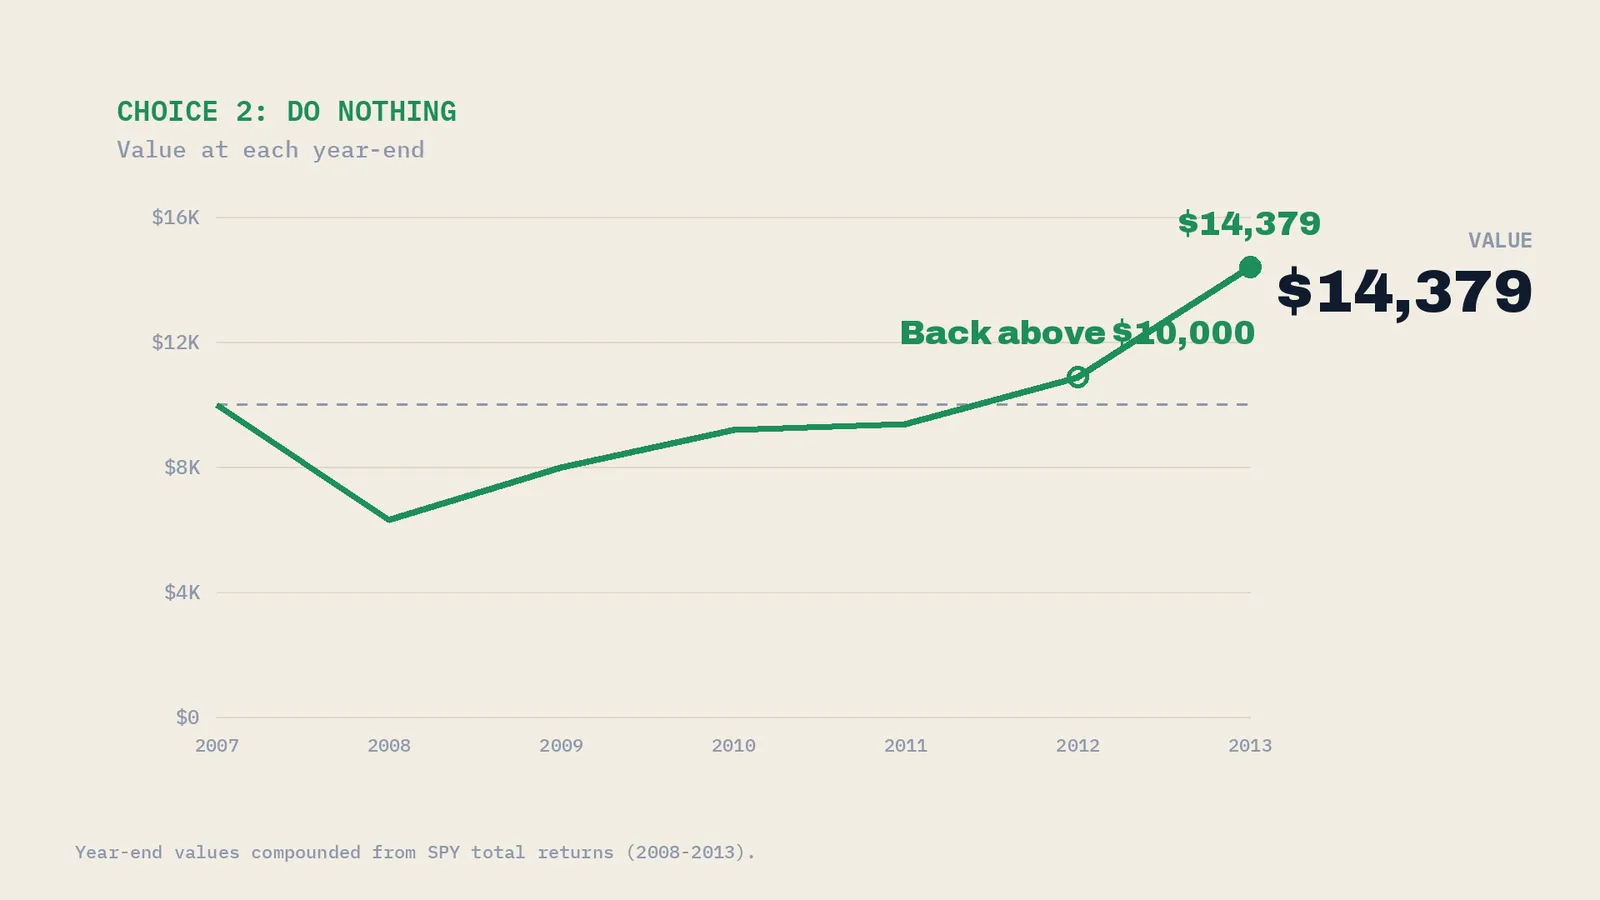
Choice 1: sell, and keep $6,320 safe. Choice 2: do nothing.
| End of year | Value |
|---|---|
| 2008 | $6,320 |
| 2009 | $7,988 |
| 2010 | $9,195 |
| 2011 | $9,369 |
| 2012 | $10,869 |
| 2013 | $14,379 |
By the end of 2012 it’s back above where it started.
The average trap
The average of those five years is 4.52%. What the money actually earned per year was 1.68%. Losses hurt more than gains help: lose 50%, then gain 50%, and the average says 0%. Your $10,000 is $7,500.
2022: tech’s turn
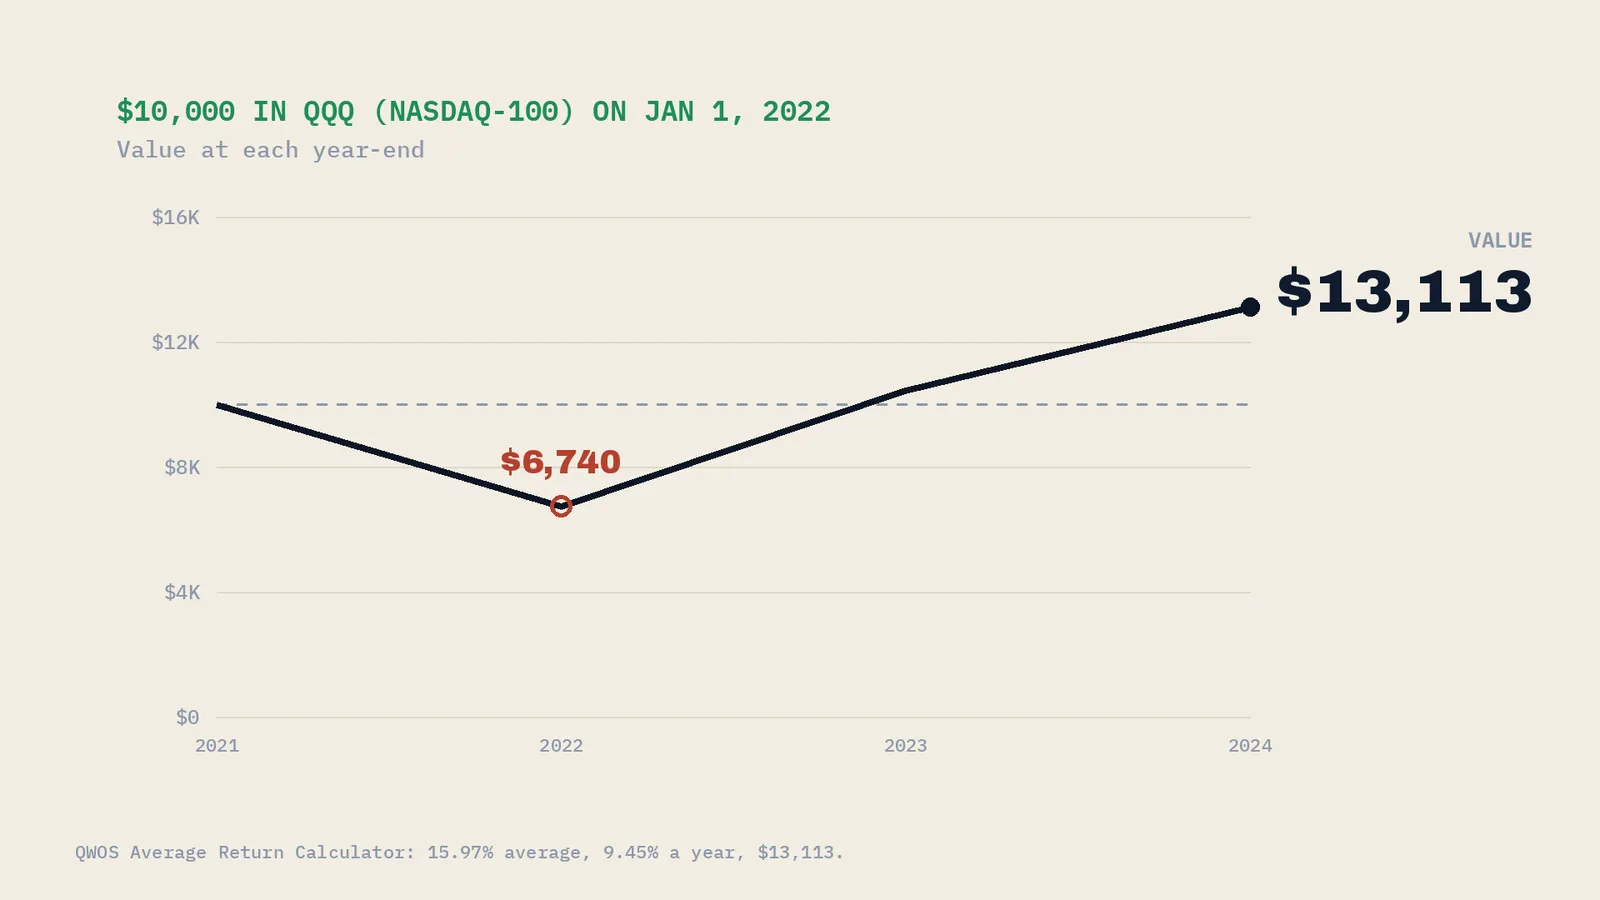
QQQ (the Nasdaq-100 fund) fell 32.6% in 2022. $10,000 became $6,740. Then 2023: up 54.9%. By the end of 2024: $13,113. Maya never sold. She kept investing every month, so she was buying while prices were down.
The Honest Check: recoveries aren’t always this quick
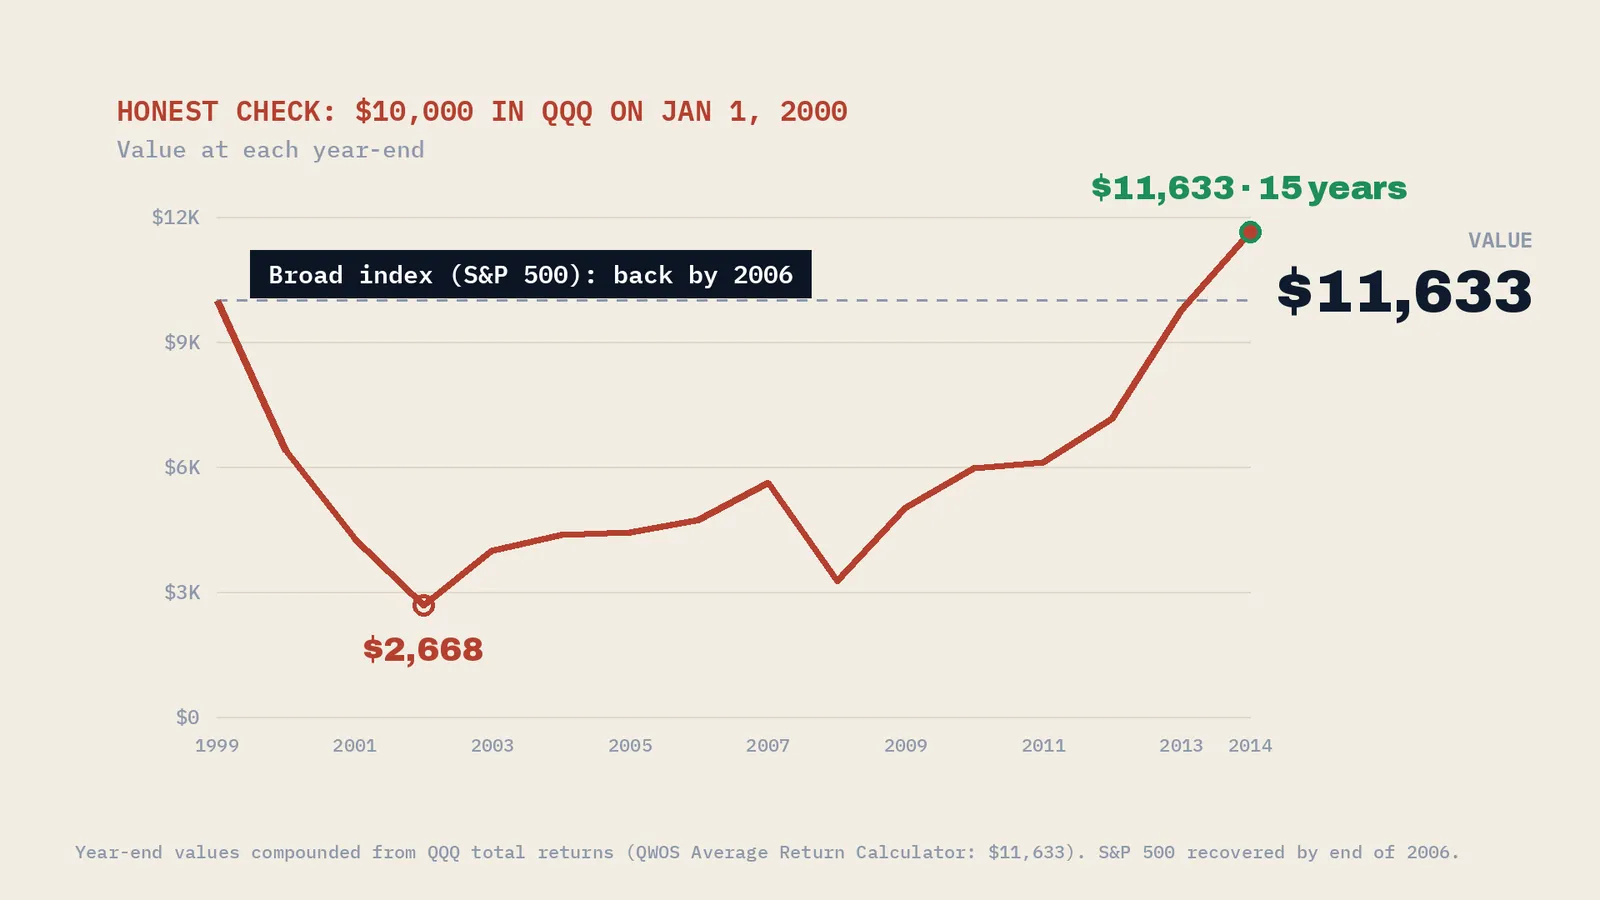
QQQ in 2000: three losing years in a row (−36.1%, −33.3%, −37.4%). $10,000 became $2,668. It didn’t get back above $10,000 until the end of 2014. Fifteen years. Even SPY, the whole S&P 500 fund, took until 2006.
That’s why our core is a broad index, not one hot corner of the market. And it’s why we project at 8% and check at 6%.
CPA Note from Daryl (tax year 2026). Selling at a loss in a regular brokerage account can offset your gains, plus up to $3,000 of other income a year, and the rest carries forward. But buy the same fund within 30 days before or after the sale and the wash-sale rule disallows the loss. None of this applies inside a 401(k) or IRA. General information, not tax advice for your situation.
What gets you through a crash
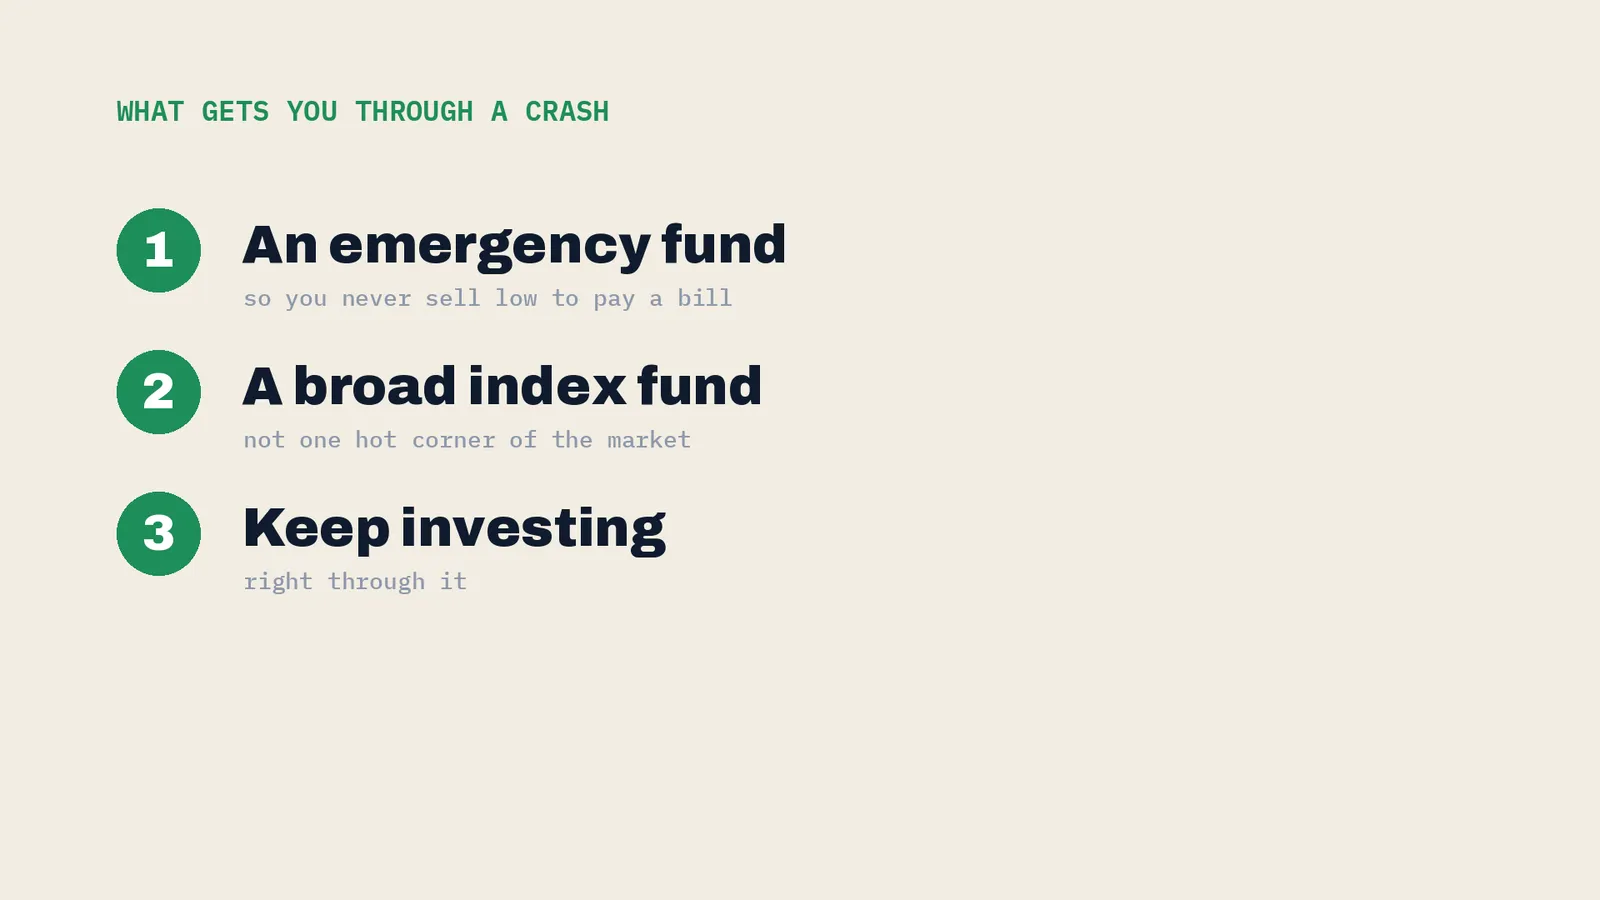
- An emergency fund, so you never have to sell low to pay a bill.
- A broad index fund.
- Keep investing, right through it.
A crash while you’re still working is a sale. A crash the year you retire is a different problem. Next up: the 4% rule, and the Honest Check it needs.
How the math works
Annual total returns are entered in the QWOS Average Return Calculator below: SPY 2008–2013 (−36.8, 26.4, 15.1, 1.9, 16.0, 32.3), QQQ 2022–2024 (−32.6, 54.9, 25.6) and QQQ 2000–2014 (−36.1, −33.3, −37.4, 49.6, 9.5, 1.2, 6.8, 18.7, −41.9, 53.8, 19.0, 2.5, 16.9, 36.6, 19.2), which leaves QQQ at $9,759 at the end of 2013. Return series differ slightly by source; with some total-return figures, QQQ crosses $10,000 a year earlier, at the end of 2013. “Average” is the arithmetic mean; “what it earned” is the geometric mean (CAGR). Year-end values compound the same returns.
Education, not financial advice. Past returns are not a promise; losses happen.