



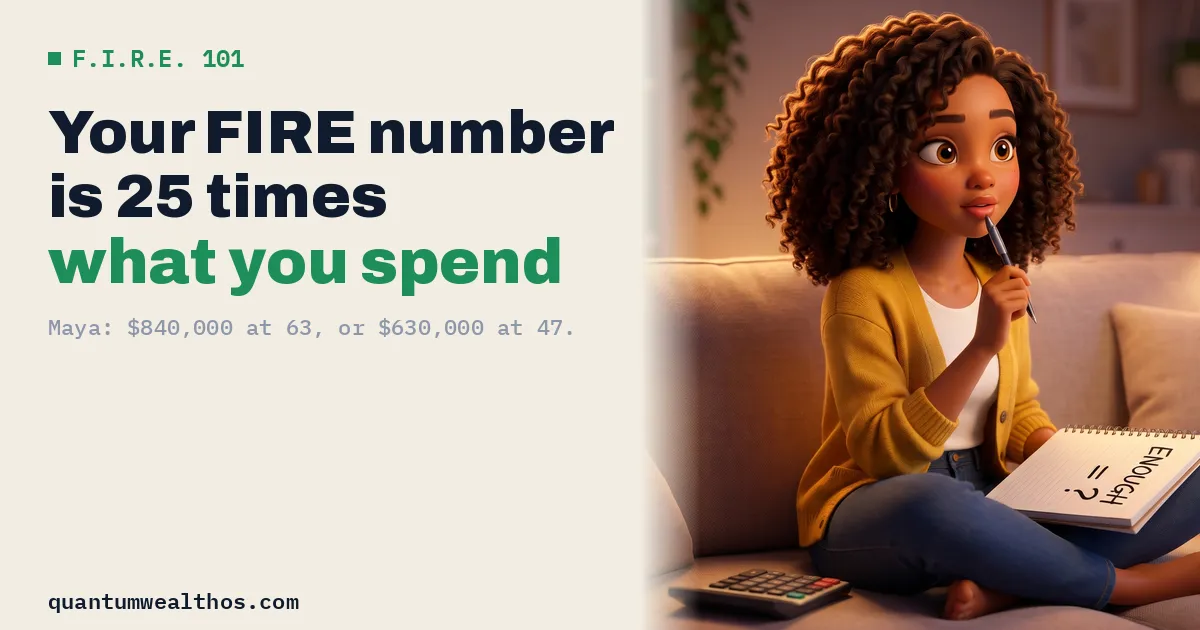
How much money is enough to never need a paycheck again? The FIRE crowd (Financial Independence, Retire Early) has a simple answer: 25 times what you spend in a year.
Where 25× comes from: the 4% rule
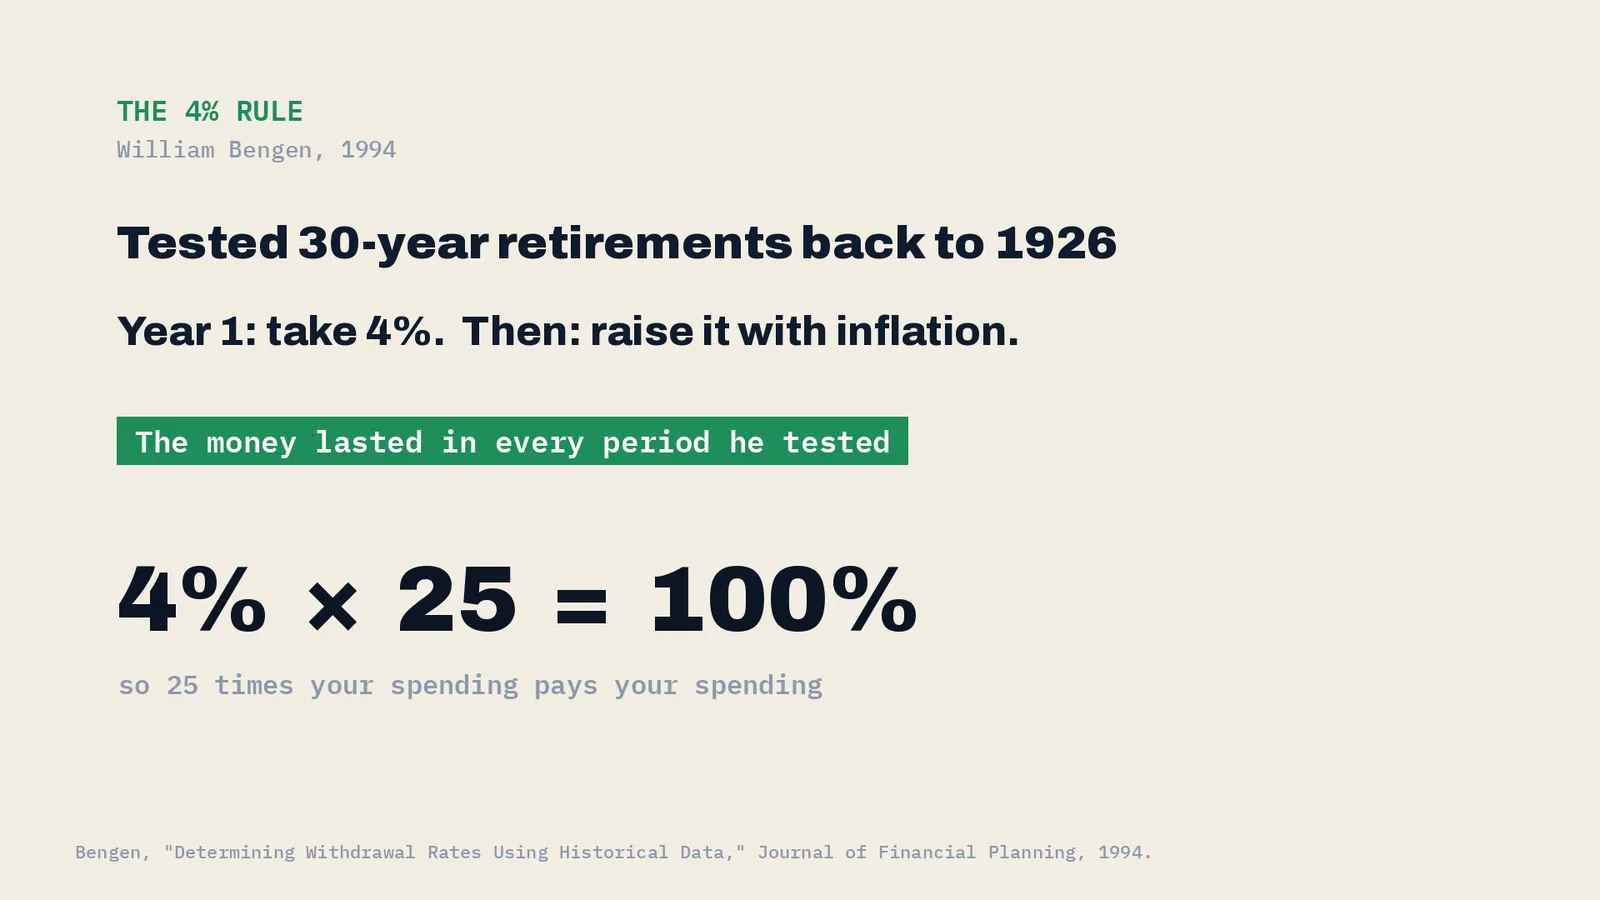
In 1994, a planner named William Bengen tested 30-year retirements going back to 1926. Taking about 4% in the first year, then raising it with inflation, the money lasted in every period he tested. And 4% of 25 times your spending is exactly your spending.
Maya’s number
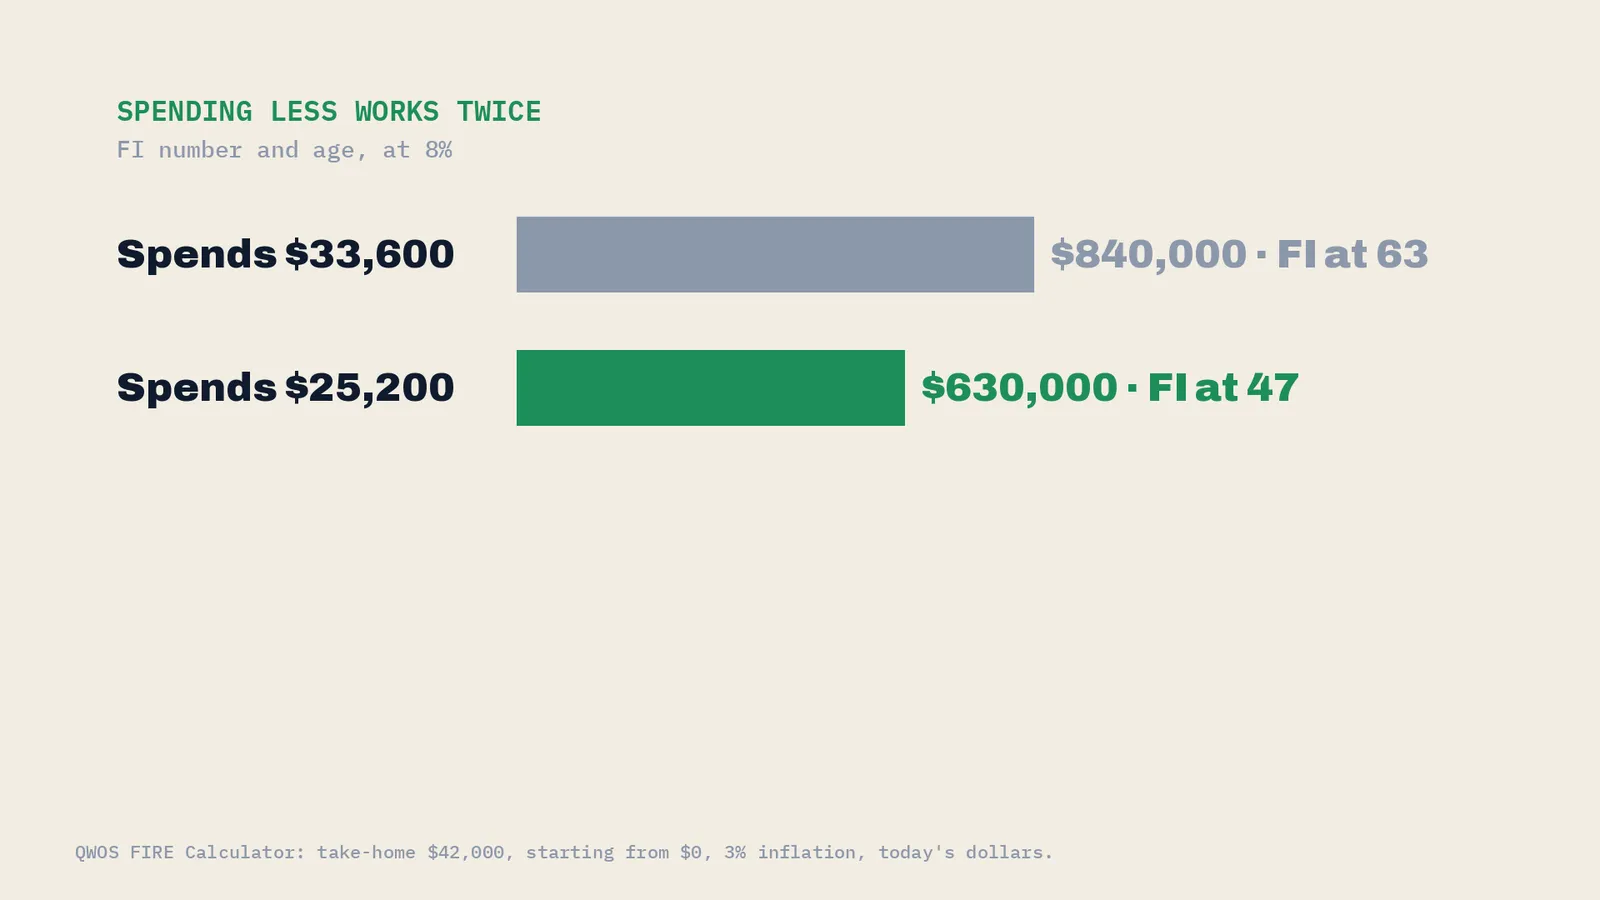
Maya takes home $42,000 and spends $2,800 a month, or $33,600 a year.
| Maya spends | Saves | FI number | FI at age (8%) |
|---|---|---|---|
| $2,800/mo ($33,600) | 20% | $840,000 | 63 |
| $2,100/mo ($25,200) | 40% | $630,000 | 47 |
At 20% saved, she’s financially independent at 63. That’s not early. That’s normal.
The biggest lever is what she spends. Living on $2,100 a month, she saves 40%, her number drops to $630,000, and her date jumps to 47. Spending less works twice: she saves more, and she needs less.
The Honest Check (two of them)
- At 6% instead of 8%, her date moves from 47 to 51.
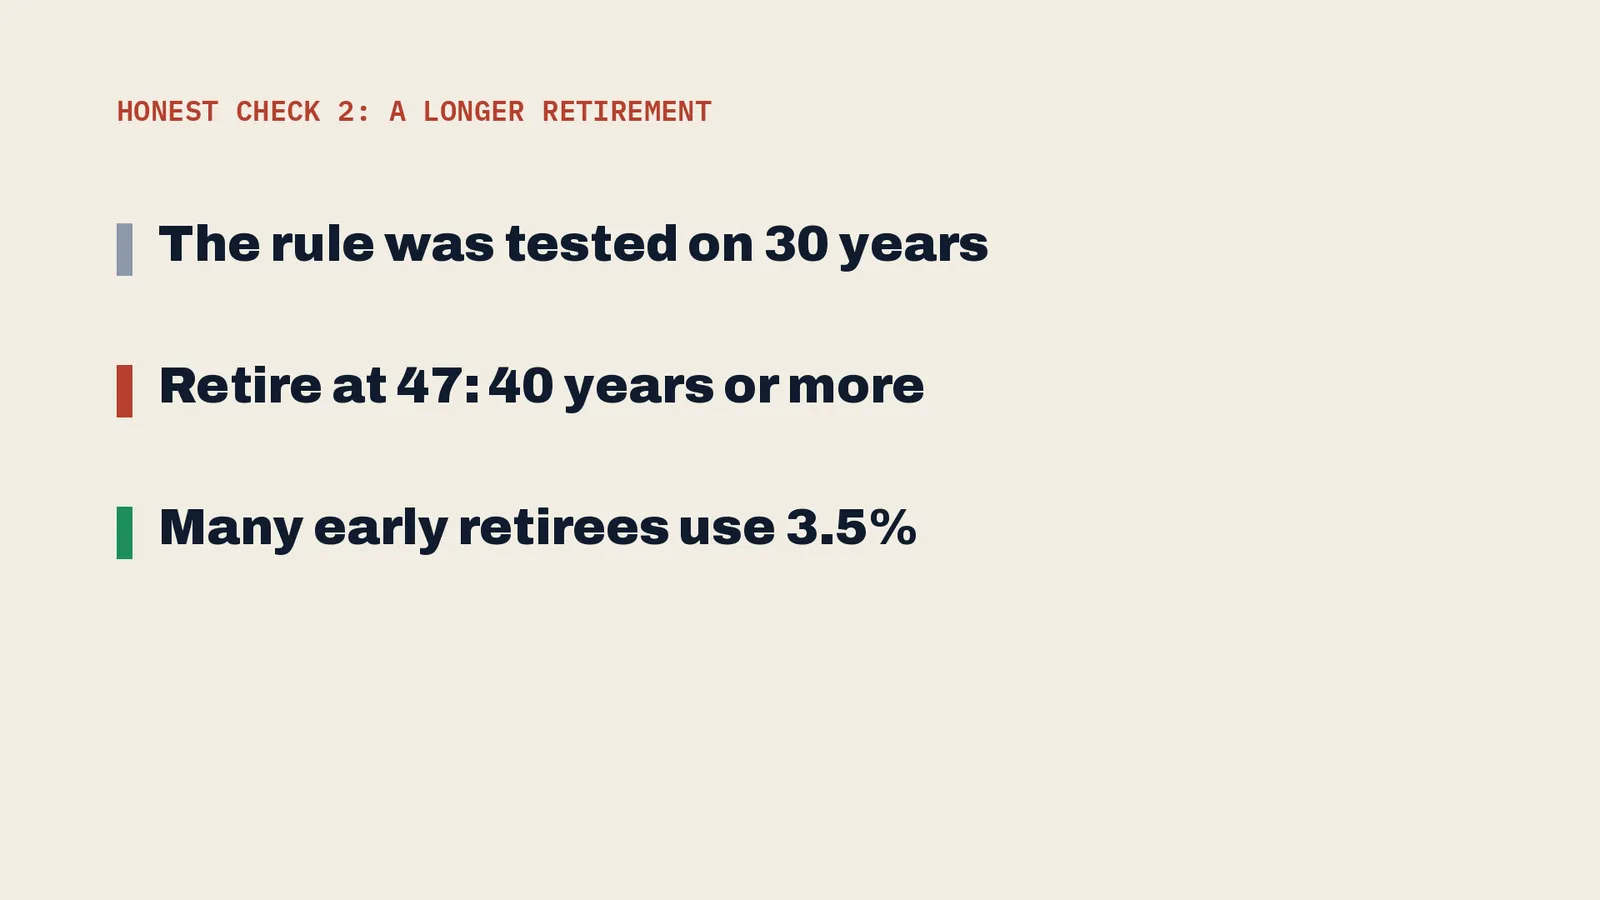
- The rule was tested on 30-year retirements. Retire at 47 and yours could last 40 years or more. Many early retirees use 3.5% instead. That makes her number $720,000, and her date 49 (at 8%).
Spending it down: where bonds fit
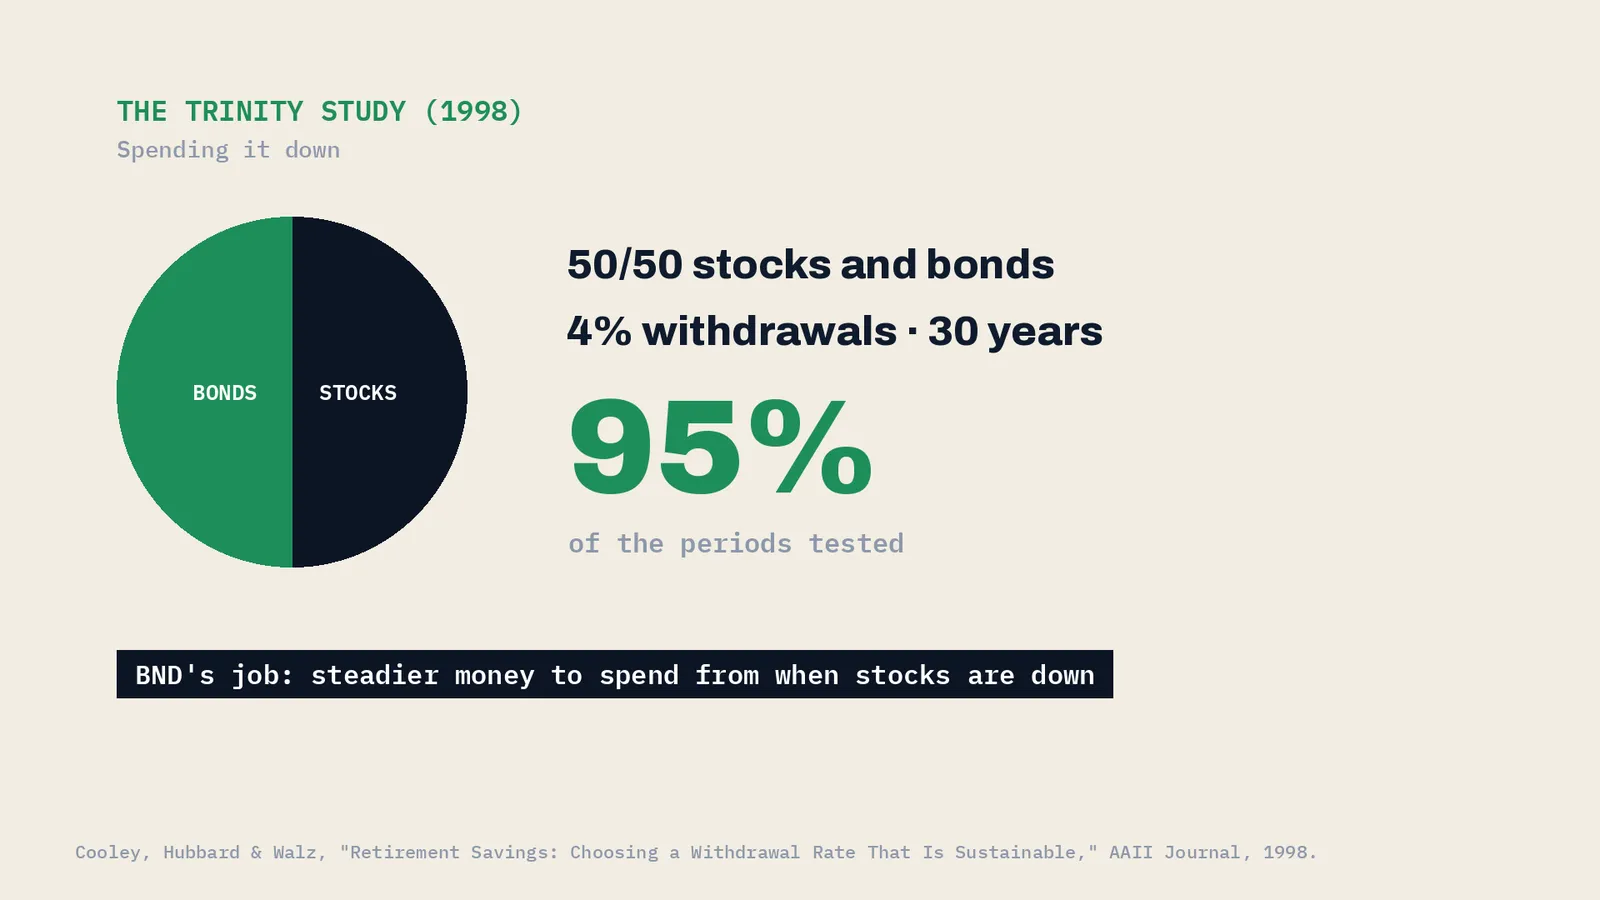
Denise is closer to the finish line, so she cares about the other half: spending it. In the 1998 Trinity Study, a 50/50 mix of stocks and bonds supported 4% inflation-adjusted withdrawals for 30 years in 95% of the periods tested. That’s BND’s job in our lineup: steadier money to spend from when stocks are down.
Your number
It starts with one figure you already have: what you spend. Multiply it by 25. Then run it yourself in the calculator below.
Next up: what actually happens to your plan in a crash? We run 2008 and 2022 through the calculator.
How the math works
Every result comes from the QWOS FIRE Calculator below: take-home income $42,000, starting at age 25 with $0 saved, 3% inflation, results in today’s dollars. FI number = yearly spending ÷ withdrawal rate ($33,600 ÷ 4% = $840,000).
Education, not financial advice. Hypothetical returns; real results vary and losses happen.
Sources: Bengen, “Determining Withdrawal Rates Using Historical Data” (1994) · Retirement Researcher: the Trinity Study · AAII: what the withdrawal rate studies show